
Consumer Products Core Business Processes
Core business processes are the processes that develop, produce, sell, and distribute an entity’s products and services. These processes do not follow traditional organisational or functional lines, but reflect the grouping of related business activities.
The model is structured in a simplified supply chain format, with six core processes, four of which are subdivided into two sub-processes.
The linear nature of the graphics should not imply that these processes always take place sequentially. Indeed many of the activities detailed within the model occur on a continuous basis, with many operating in parallel. The model is designed to provide examples, at a high level, of the activities you are likely to find in a consumer products company. The way in which that a company operates will of course be unique, and you will need to understand, and be able to group, their specific processes in a way which is relevant to the company.
The selling process is placed towards the front of the model for a specific reason. Although the activities of receiving a customer’s order, assembling and delivering the goods, and invoicing the customer, will often take place towards the end of the chain, the selling process itself, is continuous, focused on good customer account management. As more consumer products manufacturers improve their flexibility and responsiveness to their customers, the ultimate goal, of making to-order, becomes more relevant. Putting selling at the front of the manufacturer’s supply chain, emphasizes this fundamental shift, from producing for-stock, towards producing to-meet demand.
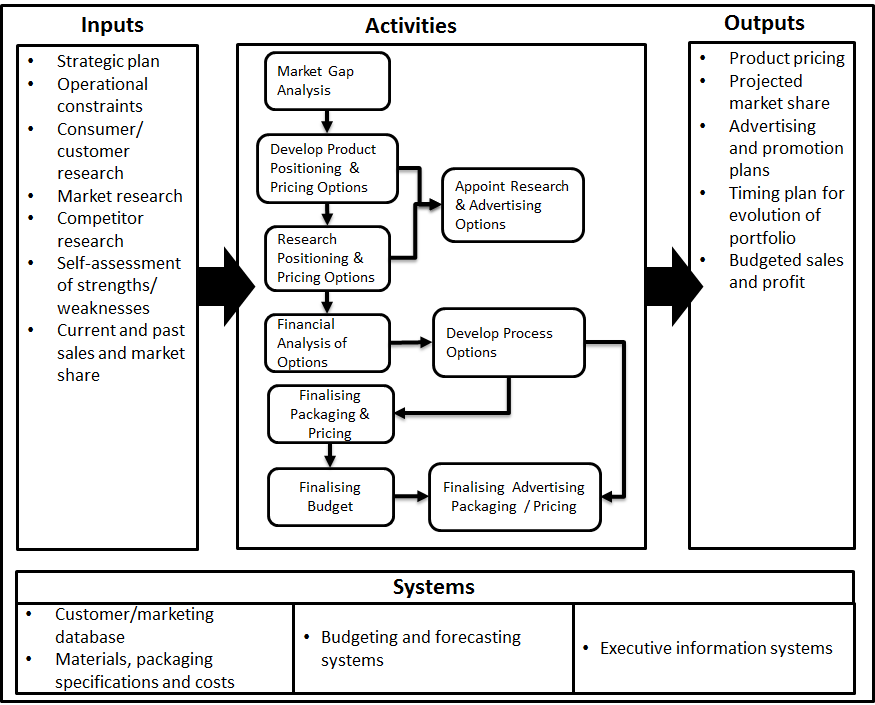
Manage Product Portfolio
This process manages the portfolio of products offered by the entity and develops new products or improves existing products as markets and customers needs change. It has two sub-process Components:
- Portfolio/ Brand Management
- New Product Development
Portfolio/ Brand Management
Process Objectives
- Focused product portfolio
- Growth opportunities
- Increased share of market
- Product differentiation (brands)
- Increased sales (volume and value)
Critical Success Factors (CSF’s) | KPI’s Linked to CSF’s |
|
|
Classes of Transactions | Routine
| Non-Routine
| Accounting Estimates
|
Risks Which Threaten Objectives | Management Responses Linked to Risks |
understands market (4)
|
|
Other Symptoms of Poor Performance |
|
Low redemption of consumer promotions
|
Overlap of product positioning
|
Performance Improvement Observations |
|
Database marketing
Accounting method review
|
Executive information systems
Strategic review of brands (positioning, pricing)
|
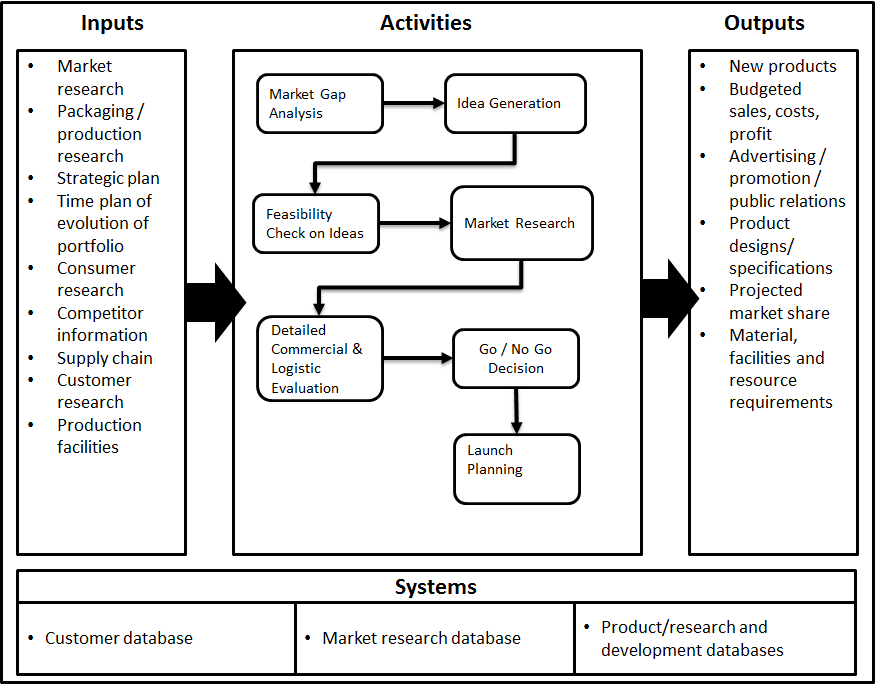
New Product Development
Process Objectives
- Improve sales and profit
- Deliver customer satisfaction
- Refresh product mix
- Expand existing market
Critical Success Factors (CSF’s) | KPI’s Linked to CSF’s |
|
|
Classes of Transactions | Routine
| Non-Routine
| Accounting Estimates
|
Risks Which Threaten Objectives | Management Responses Linked to Risks |
|
|
Other Symptoms of Poor Performance |
|
New products are copies of other products
|
Inability to service marketplace
|
Performance Improvement Observations |
|
Product development design process
Capitalisation review
|
Cost re-structuring, re-allocation
|
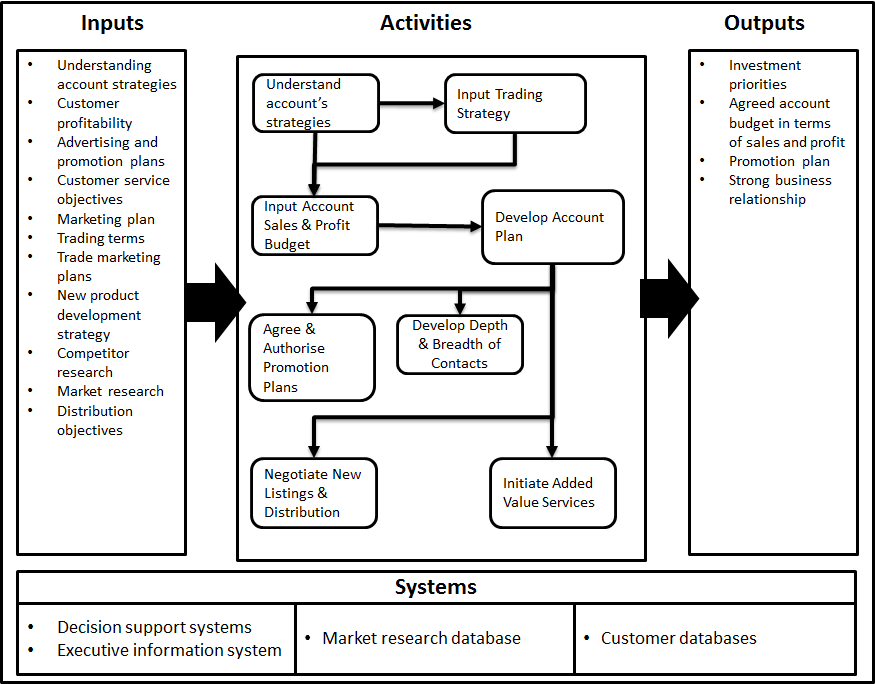
Sell Products
This process manages the entity’s customers and the interaction with them.
- Account Management
- Customer Order Management
Account Management
Process Objectives
- Maximise profitable sales
- Ensure all sales opportunities are realised
- Maintain appropriate in-store presence
- Seek collaborative development opportunities
- Establish points of differentiation vs competitors
Critical Success Factors (CSF’s) | KPI’s Linked to CSF’s |
|
|
Risks Which Threaten Objectives | Management Responses Linked to Risks |
|
|
Other Symptoms of Poor Performance |
|
No central coordination of account managers
|
Large number of credit queries
|
Performance Improvement Observations |
|
Category management
Customer / competitive analysis
|
Analysis of trade programme performance
Cost-to-service analysis
|
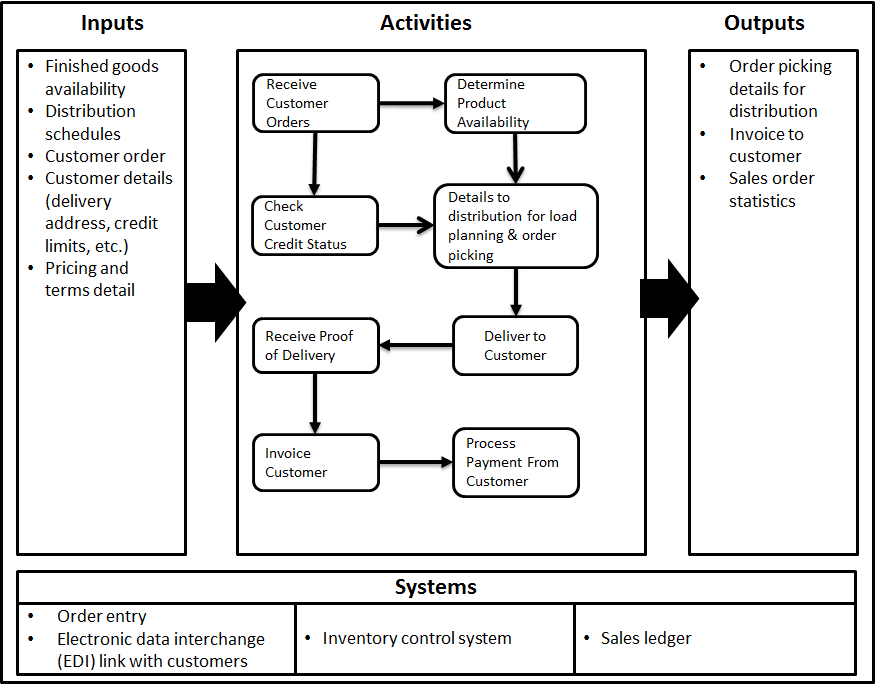
Customer Order Management
Process Objectives
- Communicate product demand to distribution
- Establish warehouse, transport, invoice cycle
- Confirm price and delivery terms
Critical Success Factors (CSF’s) | KPI’s Linked to CSF’s |
|
|
Classes of Transactions | Routine
| Non-Routine
| Accounting Estimates
|
Risks Which Threaten Objectives | Management Responses Linked to Risks |
|
|
Other Symptoms of Poor Performance |
|
Long time-span between receipt of customer order and dispatch
|
Performance Improvement Observations |
|
Business process re-engineering
Foreign sales corporation tax planning (US)
|
Enterprise package software implementation
|
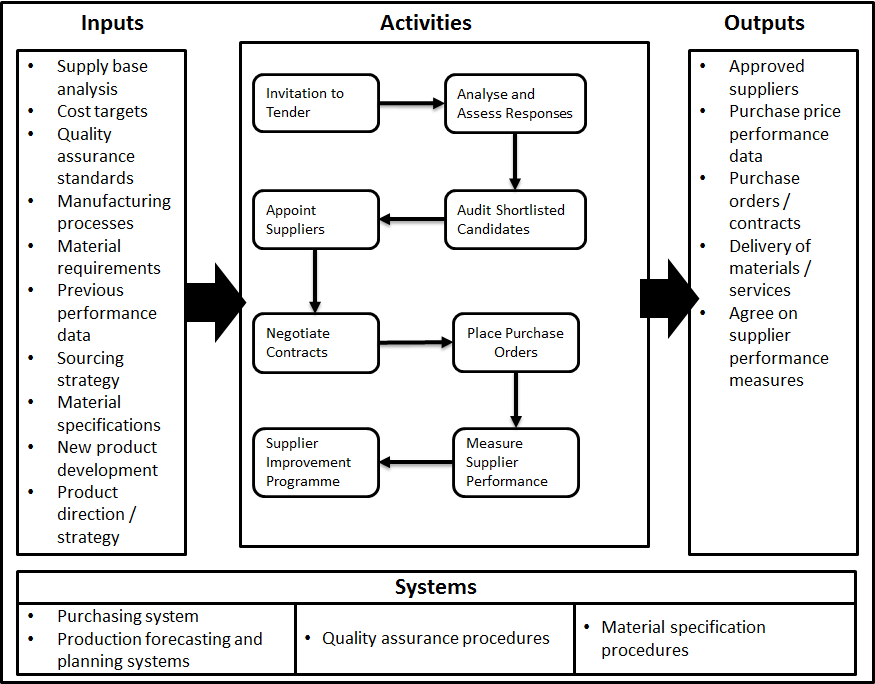
Procure Materials
Description
This process manages the entity’s supplier and the entity’s interaction with its suppliers.
- Supplier Management
- Purchase Order Management
Supplier Management
Process Objectives
- Appropriate mix of suppliers
- Quality assured supply
- A supply base committed to continuous improvement
- Enhanced margin through cost reduction
Critical Success Factors (CSF’s) | KPI’s Linked to CSF’s |
|
|
Classes of Transactions | Routine
| Non-Routine
| Accounting Estimates |
Risks Which Threaten Objectives | Management Responses Linked to Risks |
|
Supplier assessment and selection procedures (A,B)
Robust supplier performance measurement system (A,B,E)
Purchase price analysis systems (C)
Just-in-time inventory strategy (D)
|
Other Symptoms of Poor Performance |
|
Conversion difficulties
|
High turnover of suppliers
|
Performance Improvement Observations |
|
Procurement process improvement
Supply chain integration
|
Procurement team training / development
|
Purchase Order Management
Process Objectives
- Communicate material demands to suppliers
- Establish procurement; receipt; payment cycle
- Establish requirements and prices with suppliers
Critical Success Factors (CSF’s) | KPI’s Linked to CSF’s |
|
|

Classes of Transactions | Routine
| Non-Routine
| Accounting Estimates
|
Risks Which Threaten Objectives | Management Responses Linked to Risks |
|
|
Other Symptoms of Poor Performance |
|
Inordinate time between order commitment and purchase order usable by accounts payable
|
Performance Improvement Observations |
|
Business process re-engineering
|
Duty draw-back service
|
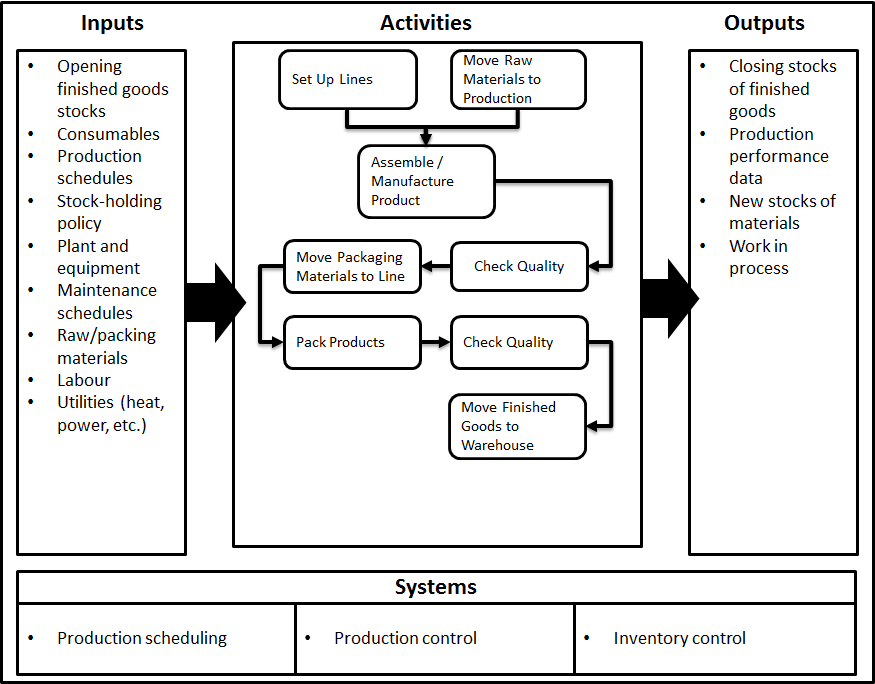
Manufacture Products
This process manages the activities that are used to produce the entity’s products. The planning and materials management aspects are included in this process.
- Production Planning & Materials Management
- Conversion
Production Planning and Materials Management
Process Objectives
- Efficient use of resources
- Smooth supply chain flow
- Minimal stock in supply chain
- Plans which can meet customer needs
- Maximisation of capacity
Critical Success Factors (CSF’s) | KPI’s Linked to CSF’s |
|
|

Classes of Transactions | Routine
| Non-Routine | Accounting Estimates
|
Risks Which Threaten Objectives | Management Responses Linked to Risks |
|
Use of cross-functional production planning process (A)
Continuously monitor actual vs plan and communicate changes (A,B)
Frequently update/check BOM file accuracy (C)
Monitor supplier performance (D)
|
Other Symptoms of Poor Performance |
|
Improper delivery quantities
|
Key drivers not included in planning
|
Performance Improvement Observations |
|
Supply chain integration
|
Business process re-engineering
|
Conversion
Process Objectives
- High quality products
- Low unit costs
- Customer responsiveness
- Minimal inventory in supply chain
- Production effectiveness
Critical Success Factors (CSF’s) | KPI’s Linked to CSF’s |
|
|
Classes of Transactions | Routine
| Non-Routine
| Accounting Estimates |
Risks Which Threaten Objectives | Management Responses Linked to Risks |
|
|
Other Symptoms of Poor Performance |
|
Absenteeism rates
|
Poor labour utilisation
|
Performance Improvement Observations |
|
Business process
re-engineering
Production facilities optimization
|
ISO 9000 programme
|
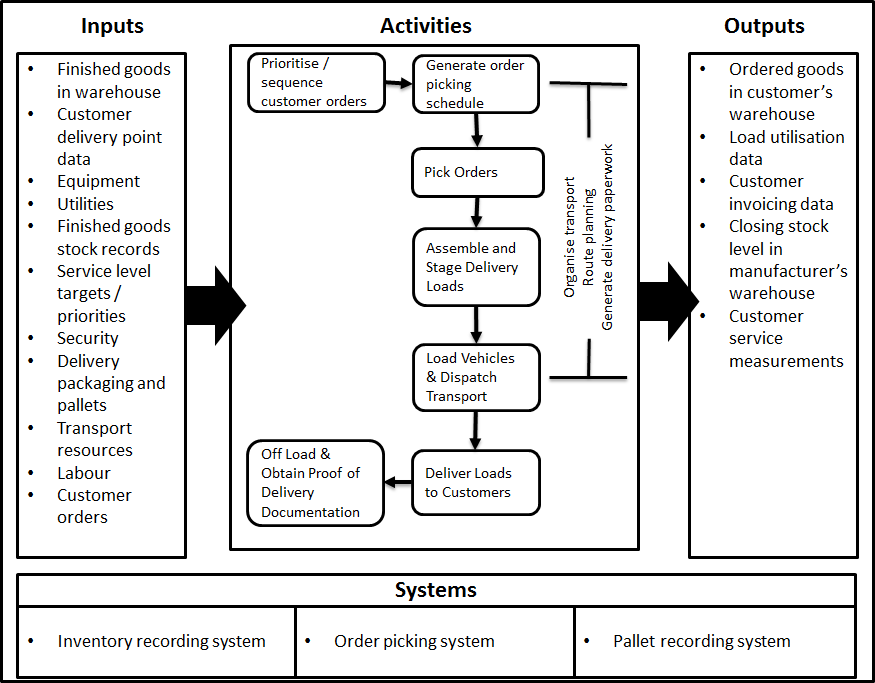
Distribute Products
Process Objectives
- Improve on-time delivery of products
- Improve order fill rate
- Provide excellent customer service at optimal cost
- Finished goods assets secured
- Product quality maintained
- Reduce order fulfillment cycle
Critical Success Factors (CSF’s) | KPI’s Linked to CSF’s |
|
|
Classes of Transactions | Routine
| Non-Routine | Accounting Estimates
|
Risks Which Threaten Objectives | Management Responses Linked to Risks |
|
|
Other Symptoms of Poor Performance |
|
Untidy warehouse
High level of back orders
|
Poor stock records
|
Performance Improvement Observations |
|
Cross-docking programmes
Distribution facility network optimisation
|
Activity-based costing (cost-to-serve analysis)
Cost re-structuring models
|
Serve Customers
Process Objectives
- Expedite resolution of customer problems
- Improve feedback quality and timeliness to allow product and process improvements
- Reduce time to reimburse customer claims
- Reduce time to repair/service product
Critical Success Factors (CSF’s) | KPI’s Linked to CSF’s |
|
|

Classes of Transactions | Routine
| Non-Routine
| Accounting Estimates
|
Risks Which Threaten Objectives | Management Responses Linked to Risks |
|
|
Other Symptoms of Poor Performance |
|
High number of abandoned calls
|
Complaint system not linked to payment
|
Performance Improvement Observations |
|
Data warehousing
Automated data transfer system
|
Accounting methods review
|
No comments :
Post a Comment