
Entity Business Model - Key Performance Indicators (KPI’s)
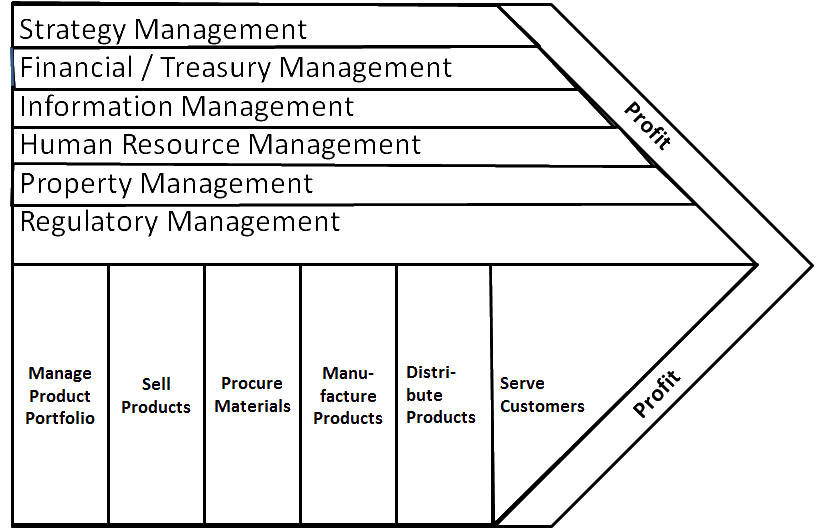
Business Process Management and Business Performance Management go hand in hand. There will be no benefits realised from re-designing the Business Processes without assigning ownership and continually measuring performance. The Entity Business Model provides a way of looking at Business Processes within the context of a specific industry. It looks at each category of process within the Business and aligns it to the Value Chain.
Below are examples of some of the KPI’s used in Consumers Products Entity Business Model example.
Strategy Management Processes
KPI | Calculation/Source of Information | Why is This Important? |
Market Share
|
Net Sales/Total Sales in the Company’s Market
|
This measures the effectiveness of the organisation’s strategic plan and its successful implementation. Increasing or declining market share is impacted by external forces and agents, competing markets, key alliances, core products and services offered, customers and the company’s business processes.
|
Return on Equity
|
Net Income/Average Shareholders Equity (excludes extraordinary items)
|
A comprehensive indicator of a company’s performance. This measures the return on funds invested by shareholders
|
Return on Assets
|
New Income/Total Assets
(excludes extraordinary items)
|
This ratio measures the return a company is able to generate for each dollar of assets invested.
|
Equity Multiplier
|
Total Assets/Average Shareholders Equity
|
This measures the dollars of assets invested for each dollar invested by shareholders.
|
Asset Turnover
|
Sales/Total Assets
|
This ratio measures the efficiency of asset utilisation.
|
Core Business Processes
Portfolio Brand Management
Consumer Promotion Spending
|
Total costs of promotion, including promotion development, advertising, administration, production and distribution over the past 12 months divided by net sales over the past 12 months.
|
Measures the relative level of spending on consumer-oriented promotion and advertising.
|
Customer Trade Spending
|
Total costs of deal, including deal development, marketing, administration, production and distribution over the past 12 months divided by net sales over the past 12 months.
|
Measures the relative level of spending on trade-oriented promotion and advertising activities.
|
Sell Product
Internal Failure Rate
|
Number of new products or line extensions terminated before they are launched for commercial sales, over the past 12 months divided by the total number of new products or line extensions initiated over the past 12 months.
|
Measure of the overall effectiveness of the company’s product development process.
|
Impact of Internal Failures
|
Number of new products or line extensions projects terminated before they are launched for commercial sale over the past 12 months divided by the total number of hours spent on introduction projects over the past 12 months.
|
Measure of the overall effectiveness of the company’s product development process.
|
Product Development Cycle Time
|
Average number of elapsed weeks to introduce new products or line extensions measured from the point at which the project has been identified (i.e., given a code name / number) to the start ship date.
|
Measure of the overall efficiency of the company’s product development process.
|
Introduction ROI
|
Incremental net income stemming from new products or line extensions over the past 12 months divided by total costs associated with the introduction, including R&D, promotions, slotting allowances, production, distribution and cost of money considerations over the past 12 months.
|
Measure of the company’s total return on its investment in new product development.
|
New Product Revenue
|
Net sales from products introduced in the past 24 months divided by total net sales for the past 24 months.
|
Measure of the role that new products play in the overall business.
|
Net Sales / Salesperson
|
Net sales over the past 12 months divided by the average number of fulltime equivalent salespeople over the past 12 months.
|
Measures the effectiveness of the company in deploying its sales resources to maximise revenue.
|
Trade Promotion Spending
|
Total trade spending over the past 12 months divided by the net sales over the past 12 months.
|
Measures the amount of trade support used to generate the company’s sales.
|
Customer Order Error Rate
|
Number of customer orders requiring re-entry of correction due to internal errors over the past 12 months divided by the total number of customer orders taken over the past 12 months.
|
Measures the efficiency and accuracy of the organisation’s customer order entry process. If error rates are high despite the organisation’s use of EDI, it may be an indication of systems integration problems.
|
Procure Materials
EDI Orders
|
Number of purchase order line-items transmitted to suppliers via EDI for the past 12 months divided by the total number of purchase order line-items created in the past 12 months.
|
A measure of the relative efficiency in communicating purchase orders to suppliers.
|
Suppliers’ CRP Capabilities
|
Number of suppliers under CRP agreements during the past 12 months divided by the average number of active suppliers during the past 12 months.
|
A measure of the relative efficiency in replenishment of raw materials.
|
Raw Material CRP Usage
|
Number of raw material items covered by CRP agreements under the past 12 months divided by the total numb.er of raw materials purchased in the past 12 months
|
A measure of the relative efficiency in replenishment of raw materials.
|
Supplier On-Time Delivery
|
Purchase order on-time delivery windows (i.e., 1 day early to 0 days late).
|
This measure will give added significance to window a supplier’s on-time delivery performance.
|
Supplier On-Time Delivery Percentages
|
Number of purchase order line-items in the past 12 months that were delivered on-time divided by total order line-items for the past 12 months
|
Along with the on-time window, this measure provides an accurate indication of the overall delivery perfomance of a company’s supply base.
|
Supplier Quality
|
Number of quality complaints filed against suppliers in the past 12 months divided by the total order line-items for the past 12 months.
|
Measures the quality performance of the company’s supply base.
|
Purchase Order Error Rate
|
Number of purchase orders requiring re-entry or correction due to internal errors over the past 12 months divided by the total number of purchase orders entered over the past 12 months.
|
Measures the efficiency and accuracy of the organisations’ purchase order entry process. If error rates are high, it may be an indication of systems integration problems.
|
Manufacture Products
Changeover Time
|
Average time required to stop producing one SKU and start running another SKU on the same production line. Should be an average of all relevant production lines (division or company-wide).
|
Measures the flexibility of the company’s production processes.
|
Capacity Utilisation
|
Actual number of cases produced for all relevant product lines (division or company-wide) in the past 12 months (do not include contract divided by the total number of cases that could possibly be produced using all relevant product lines [division or company-wide] for the past 12 months).
|
Measures the ability of the company to properly match its production capabilities.
|
Scrap Rate
|
Value of direct materials consumed over the past 12 months divided by the value of the portion of direct materials consumed over the past 12 months which was converted into product.
|
Measures the efficiency of the company’s production and inventory control processes.
|
Percentage of Spending on Preventive Maintenance
|
Amount spent on preventive maintenance activities over the past 12 months, including parts and labour divided by the total amount spent on all maintenance activities over the past 12 months.
|
Preventive maintenance spending indicates whether the organisation is actively working to prevent manufacturing problems or if they are more reactive to these issues.
|
Distribute Products
Order Fill Rate
|
Number of customer orders shipped with all line items filled precisely as originally ordered and in the quantities requested by the customer, including distributor replenishment signals for the past 12 months divided by the number of customer orders shipped, including distributor replenishment signals, for the past 12 months.
|
Measures the effectiveness of the company’s order fulfillment process.
|
Order Fulfillment Cycle Time
|
Average elapsed time from receipt of orders to delivery on the dock or shelf of the customer over the past 12 months.
|
Measures the efficiency of the company’s order fulfillment process.
|
On-Time Delivery
|
Number of orders that arrive on the customer dock or shelf on the date and within the delivery time window originally requested for the past 12 months divided by the number of customer orders shipped for the past 12 months.
|
Measures the company’s overall delivery performance with its customers.
|
Continuous Replenishment Capabilities
|
Number of customers being served under CRP agreements during the past 12 months divided by the average number of customers during the past 12 months.
|
Measures the company’s success at implementing continuous replenishment programmes with its customers, which is a key service under ECR.
|
Number of SKU’s covered by CRP agreements referenced above divided by the average number of SKU’s over past 12 months.
|
Measures the company’s success at implementing continuous replenishment programmes with its customers, which is a key service under ECR.
|
Days Supply
|
Average number of days supply of finished product inventory, including at plants, in transit and at distribution centres.
|
Measures the company’s overall ability to maintain as little inventory in the system as possible, yet still maintain targeted customer service levels.
|
Total Logistic Cost per Case
|
Total cost of storing and shipping finished product from the palletiser to the customer, including third-party distribution costs, inter-company freight cost, and administrative logistics expenses for the past 12 months divided by the total number of cases shipped to customers in the past 12 months.
|
Measures the company’s cost of getting product to customers.
|
Serve Customers
Warranty Costs
|
Total warranty expense during the past 12 months divided by the net sales over the past 12 months.
|
Measures the company’s overall warranty expenses.
|
Un-saleables
|
Total un-saleables expense during the past 12 months divided by the net sales over the past 12 months.
|
Measures the company’s overall un-saleable expenses.
|
Consumer Complaints per 1000 EQCs shipped
|
Total number of consumer complaints recorded during the past 12 months divided by the total number of equivalent cases (EQC) shipped (in 000’s) for the past 12 months.
|
Measures the company’s overall quality awareness and consumer’s product acceptance.
|
Customer Complaints
|
Total number of customer complaints processed over the past 12 months divided by the total number of customer orders processed over the past 12 months.
|
Measures the company’s overall customer service effectiveness.
|
Resource Management Processes
Financial and Treasury Management
Warranty Costs
|
Total warranty expense during the past 12 months divided by the net sales over the past 12 months.
|
Measures the company’s overall warranty expenses.
|
Un-saleables
|
Total un-saleables expense during the past 12 months divided by the net sales over the past 12 months.
|
Measures the company’s overall un-saleable expenses.
|
Consumer Complaints per 1000 EQCs shipped
|
Total number of consumer complaints recorded during the past 12 months divided by the total number of equivalent cases (EQC) shipped (in 000’s) for the past 12 months.
|
Measures the company’s overall quality awareness and consumer’s product acceptance.
|
Customer Complaints
|
Total number of customer complaints processed over the past 12 months divided by the total number of customer orders processed over the past 12 months.
|
Measures the company’s overall customer service effectiveness.
|
Effective Federal Income Tax Rate
|
Federal Income Tax Expense / Pre-tax Accounting Income.
|
These are broad measures of expense / revenue recognition and timing of payment of taxes.
|
Effective State Income Tax Rate
|
State Income Tax Expense / Pre-tax Accounting Income.
|
These are broad measures of expense / revenue recognition and timing of payment of taxes.
|
Information Management
Sales Price Accuracy Percentage
|
Number of Items Rung Correctly Through the POS System / Total Number of Items Rung Through the Registers.
|
This measures the accuracy and completeness of the item master files and updating of shelf labels.
|
Level of Vendor Interface and Systems Support
|
· Does the company require vendors to use EDI?
· Number of Units Ordered per Year with EDI / Total Number of Units Ordered per Year
· Does the company use ASN (advanced shipping notification)?
· Does the company use common bar-coding practices (i.e., UCC 128)?
· Does the company share POS information with its vendors?
|
These open-ended questions assist in evaluating a company’s level of vendor partnering, data processing capabilities and level of competitiveness.
|
Other Data Processing
|
Number of personnel in MIS
Amount spent on non-recurring MIS projects (including outside consultants) within the last year.
|
In addition to providing a broad measure of data processing capabilities, these measures may point to R&E credit opportunities.
|
Property Management
Employee Turnover
|
Employees Terminated/Average Number of Employees (not full-time equivalents).
This calculation should exclude terminations resulting from corporate restructurings and store closings.
|
This measures employee satisfaction and the organisation’s commitment to training. Unfavourable outcomes may point to non-competitive compensation arrangements, lack of expected skill sets or unproductive employees.
|
Training Hours per Employee
|
Number of Hours Training Provided / Average Number of Employees (not full-time equivalents).
|
This measures the company’s commitment to training, and may point to issues with respect to employee qualification, lack of expected skill sets, unproductive employees, etc.
|
Employee Suggestions Per Employee Per Year
|
Number of Submitted Suggestions per Year / Average Number of Employees (not full-time equivalents).
|
This ratio is an indicator of management’s view of employees and their utilisation for improvement and recommendations.
|
HR Headcount to Company Headcount
|
Human Resource Department Headcount / Total Company Headcount.
|
These metrics are broad measures used to identify opportunities for HR performance improvements.
|
HR Costs to Company Headcount
|
Human Resource Department Costs / Total Company Headcount.
|
These metrics are broad measures used to identify opportunities for HR performance improvements.
|
HR Cost to Sales Percentage
|
Human Resource Department Costs / Net Sales.
|
These metrics are broad measures used to identify opportunities for HR performance improvements.
|
Construction Costs per Square Foot
|
Construction Project Costs / Number of Square Feet Constructed.
|
Measures the efficiency of the construction process.
|
Maintenance Costs per Square Feet
|
Maintenance Costs (in-house and outside contractors) / Number of Square Feet.
|
Measures the efficiency of the maintenance staff or equipment.
|
Financial Statement Ratio Analysis
Short-Term Liquidity | ||
Current Ratio
|
Current Assets / Current Liabilities
|
Measures the extent to which current obligations are covered by current assets. Since the process of generating current assets and satisfying current obligations is ongoing, the current ratio can be considered a measure of the “margin of safety” at a point in time.
|
Quick Ratio
|
(Cash and Cash Equivalents, including Marketable Securities + Accounts Receivable) / Current Liabilities
|
Evaluates a firms cash resources (without inventory and other current assets such as prepaids) relative to cash obligations. More conservative than the current ratio, the quick ratio recognises that conversion of all inventory to cash may be less certain or may not occur as quickly as other types of current assets.
|
Cash to Current Liabilities
|
(Cash and Cash Equivalent) / Current Liabilities
|
Cash currently available to satisfy current liabilities. It is more conservative than the quick ratio because it excludes accounts receivable, which may not be entirely and/or immediately convertible to cash.
|
Cash to Current Assets
|
(Cash and cash equivalent) / Current Assets
|
The ratio of cash to total current assets is a measure of the degree of liquidity of current assets. The higher the ratio, the more liquid is current assets.
|
Cash Flow from Operations to Average Current Liabilities
|
Cash Flow from Operating Activities / Average Current Liabilities
|
Actual cash generated from operations relative to current obligations. This measure uses actual cash flows, instead of current and potential cash resources from the balance sheet. Thus it takes into consideration the actual convertibility of current assets to cash.
|
Liquidity Index
|
(Accounts Receivable x A/R collection period) + (Inventory x Number of Days to sell Inventory) / Current Assets
|
The number of days it takes to convert current assets to cash. Increases in the index signify a deterioration in liquidity.
|
Working Capital
|
Current Assets - Current Liabilities
|
Liquid resources available for uncertainties.
|
Accounts Receivable Turnover
|
Net Credit Sales / Average Accounts Receivable
|
Number of times receivables are collected during the year. A higher turnover implies that the receivables are more liquid. The accounts receivable activity ratios also give an indication of the effectiveness of the company’s credit policies and the level of investment in receivables needed to maintain the company’s level of sales. Also, if turnover is slowing, it may be an indication that receivables are overstated.
|
Accounts Receivable Collection Period
|
365/Accounts Receivable Turnover
|
Average number of days it takes to collect from customers. (See discussion of receivables turnover above.)
|
Inventory Turnover
|
Cost of Goods Sold / Average Inventory
|
Number of times inventory turns during a period. This provides information about the liquidity of inventory; a higher turnover implies that the inventory is more liquid. It may also be an indicator of the efficiency of the company’s inventory management. The higher the ratio, the shorter the time a company holds idle inventory, which has a positive effect on liquidity. Inventory turnover, especially when examined by product line, may raise questions about the quality and valuation of inventory.
|
Number of Days to Sell Inventory
|
365/Inventory Turnover
|
Average number of days inventory is on hand. (See discussion of inventory turnover above.)
|
Conversion Period
|
Number of Days to Sell Inventory + Accounts Receivable Collection Period
|
Days it takes for inventory to be converted to cash. A longer conversion period decreases liquidity
|
Average Number of Days Payable Outstanding
|
365 Average Accounts Payable / Purchases
Purchases Estimate = Ending Inventory + Cost of Goods Sold (excluding Depreciation) - Beginning Inventory
|
Average number of days the company takes to pay its creditors. Increasing the number of days it takes to pay creditors increases liquidity. This ratio may also give information about a company’s cash management, for example, is the company having difficulty meeting current obligations, or is the company failing to take advantage of cash discounts?
|
Net Trade Cycle
|
Days to Sell Inventory + Accounts Receivables Collection Period - Days Payables Outstanding
|
Average number of days cash is tied up by the company’s current operating cycle. The operating cycle encompasses the time from cash outlay for purchases until the collection of receivables resulting from sales of goods or services. To the extent that a company may delay payments to vendors, the number of days in the operating cycle is reduced. The higher the net trade cycle, the larger the required investment in working capital.
|
Capital Structure and Long-Term Solvency | ||
Total Debt to Total Assets
|
Total Debt / Total Assets
|
Extent to which a firm borrows to finance its operations.
|
Total Debt to Equity
|
Total Debt / Total Equity
|
Creditor’s funds as a percentage of stockholders’ funds. A debt to equity ratio which is significantly higher than peers; may indicate increased financial risk.
|
Total Liabilities to Total Equity
|
Total Liabilities / Total Equity
|
This is a form of debt to equity ratio which includes all liabilities. It is a comprehensive measure of the relationship between debt and equity.
|
Fixed Assets to Equity
|
Net PP&E / Total Equity
|
Measures the relationship between fixed assets and equity capital. A ratio in excess of 1:1 indicates that a portion of fixed assets are financed with debt.
|
Earnings Coverage of Fixed Charges (Time Interest Earned)
|
(Income Before Taxes + Interest Expense + One-Third of Rental Expense) / (Interest Incurred + One-Third of Rental Expense)
|
Measures the relationship between debt-related fixed charges and the earnings available to meet those charges. One-third of rental expense is a rule of thumb used to estimate the interest implicit in long-term leases which are not capitalised.
|
Cash Flow Coverage of Fixed Charges
|
(Cash Flow from Operating Activities + Taxes Paid + Interest Expense Paid + One-Third of Rent Expense) / (Interest Expense + One-Third of Rent Expense)
|
Cash flow from operations available to cover debt-related fixed charges.
|
Z-Score (Altman Model)
|
Z = 1.2A + 1.4B + 3.3C + .6D + 1.0E where:
· A=Working Capital/Total Assets (Liquidity)
· B=Retained Earnings/Total Assets (Age of Firm and Cumulative Profitability
· C=Earnings Before Interest and Taxes/Total Assets (Profitability)
· D=Market Value of Equity/Book Value of Debt excluding Deferred Taxes (Financial Structure)
· E=Sales/Total Assets (Assets Turnover)
|
This model has been useful in predicting bankruptcy within the short run (one or two years). Altman found that, in his test of the Z-score model, Z-scores of less than 1.8 successfully predicted bankruptcy and companies with Z-scores above 3.0 were correctly predicted not to go bankrupt. The area of Z-scores between 1.8 and 3.0 is considered a gray area because companies with scores in this range were subject to mis-classification.
|
Return On Investment | ||
Return On Total Assets (ROA)
|
Net Income Before Extraordinary Items / Average Total Assets
|
Measures the return on investment of both the stockholders and creditors. This ratio is an indication of how well management utilises assets to generate profits. (When this ratio is computed using net income minus the after tax interest cost, it measures the operating efficiency of the firm without regard to its financial structure.)
|
Return on Common Equity (ROE)
|
Net Income Before Extraordinary Items / Average Common Equity
|
Measures return on investment for common stockholders.
|
Equity Multiplier
|
Average Total Assets / Average Common Equity
|
Indicates the degree to which assets are internally financed. The larger the ratio, the higher the degree of outside funding.
|
Financial Leverage Index
|
Return On Equity / Return On Total Assets
|
Measures the effect of leverage on operating results. Greater than 1 means firm is successfully trading on equity; that is, the return on equity capital exceeds the return on assets.
|
Equity Growth Rate (Return on Stockholder’s Equity)
|
(Net Income Before Extraordinary Items - Cash Dividends) / Average Common Equity
|
Measures the return to the common shareholder which is internally reinvested and not paid out to them in the form of dividends.
|
Asset Utilisation | ||
Asset Turnover Ratio
|
Net Sales / Average Total Assets
|
Efficiency of asset utilisation.
|
Sales to Cash and Equivalents
|
Net Sales / Average Cash and Cash Equivalents
|
A high turnover rate may indicate a cash shortage.
A low turnover rate may indicate that the company is holding idle and unnecessary cash balances.
|
Sales to Receivables
|
Net Sales / Average Trade Accounts Receivables
|
This ratio is especially applicable to a company which sells primarily on credit. A low turnover rate may indicate an over extension of credit, inability of customers to pay, or a poor collection process.
|
Sales to Inventories
|
Net Sales / Average Inventories
|
A low turnover rate may indicate overstated inventory, overstocking, obsolete or slow moving inventories, overestimates of sales, etc. A higher than normal turnover rate may indicate inadequate inventory levels to meet sales demand.
|
Sales to Working Capital
|
Net Sales / Average Working Capital
|
Working capital level to maintain sales. A higher ratio implies better utilisation of working capital, but may also indicate a working capital deficiency
|
Sales to Fixed Assets
|
Net Sales / Average Net PP&E
|
Measures efficiency of capital investment. A higher ratio indicates more efficient use of fixed assets to generate sales. When examining this ratio, consider that increases in plant and capacity may occur in large increments while sales growth is relatively continuous. Other factors such as excess capacity, inefficient or obsolete equipment, multishift operations, temporary changes in demand, and interruptions in supply may affect the relationship of sales to fixed assets.
|
Sales to Short-Term Liabilities
|
Net Sales / Average Total Current Liabilities
|
The amount of short-term credit a company requires depends on its level of activity (sales), and the degree to which it is able to obtain credit also depends upon sales levels. Short-term credit reduces the firms investment in working capital.
|
Operating Income to Total Assets
|
Operating Income / Average Total Assets
|
Represents operating profits generated for a given asset level. A higher ratio indicates more efficient use of assets.
|
Proprietary Credit Sales to Total Net Sales
|
Proprietary Credit Sales / Total Net Sales
|
Measures penetration of customer base with proprietary credit programmes.
|
Profitability Return On Sales | ||
Net Profit Margin
|
Net Income Before Extra Items / Net Sales
|
Profitability net of all expenses.
|
Gross Margin Percent
|
Gross Profit / Net Sales
|
Relationship between sales and cost of goods sold.
|
Operating Income to Sales
|
Operating Income / Net Sales
|
Profitability from core operations.
|
Pre-tax Income to Sales
|
Net Income Before Taxes / Net Sales
|
Pre-tax profitability.
|
EBITA to Sales
|
EBITA (Earnings Before Interest, Taxes, Depreciation and Amortisation) / Net Sales
|
Operating margin before depreciation.
|
Operating Performance | ||
Sales Growth
|
(Current Year Sales - Prior Year Sales) / Prior Year Sales
|
Increase in sales over the previous period. As sales increase, inventory and accounts receivable generally increase.
|
Inventory Growth
|
(End. Inventory - Beg. Inventory) / Beginning Inventory
|
Generally, inventory growth will mirror sales growth. If inventory is growing much faster than sales, this may be an indication that inventory is not selling well or is obsolete.
|
Accounts Receivable Growth
|
(End. Accounts Receivable - Beg. Accounts Receivable) / Beginning Accounts Receivable
|
Generally, accounts receivable growth will mirror sales growth. If accounts receivable is growing much faster than sales, this may be an indication that the company is having difficulty collecting from customers, which may ultimately result in negative cash flows.
|
Market Performance and Earnings Per Share | ||
Price Earnings Ratio
|
Closing Market Price / Earnings Per Share for Most Recent Four Quarters
|
Measures the multiple at which the market is capitalising the earnings per share of the company.
|
Dividend Payout Ratio
|
Dividends Per Share / Earnings Per Share
|
Measures the proportion of earnings that is currently paid out as cash dividends.
|
Earnings Per Share - Fully Diluted
|
(Net Income Before Extraordinary Items - Preferred Dividends) / Weighted Average Number of Common Shares Outstanding
|
Note: Calculation will include adjustments when potentially dilutive securities or common stock equivalents exist.
|
Earnings Per Share - Fully Diluted, Including Extraordinary Items
|
(Net Income-Preferred Dividends) / Weighted Average Number of Common Shares Outstanding
|
Note: Calculation will include adjustments when potentially dilutive securities or common stock equivalents exist.
|
Dividend Per Share
|
Dividends Declared / Outstanding Common Shares
|
Dividends awarded to common stockholders.
|
Analysis of Depreciation | ||
Accumulated Depreciation as a Percent of Fixed Assets
|
Accumulated Depreciation / Total PP&E
|
Indicates aging of assets. When we consider the aging of assets, we may examine repairs and maintenance expense and fixed asset turnover ratios to determine if the assets are being properly maintained and efficiently utilised.
|
Annual Depreciation Expense as a Percent of Fixed Assets
|
Depreciation Expense / Average Gross PP&E
|
Large fluctuations could indicate management of current and future income.
|
Annual Depreciation Expense as a Percent of Sales
|
Depreciation Expense / Net Operating Revenue
|
Large fluctuations could indicate management of current and future income.
|
Other Financial Ratios | ||
Allowance For Doubtful Accounts to Accounts Receivable
|
Allowance for Doubtful Accounts / Accounts Receivable - Gross
|
Percent of expected future write-offs of accounts receivable.
|
Finished Goods Inventory as a Percent of Total Assets
|
Finished Goods Inventory / Total Assets
|
An increasing ratio may be an indication of inventory obsolescence or overstocking.
|
Other Non-Current Assets as a Percent of Total Assets
|
Other Non-Current Assets / Total Assets
|
Other non-current assets may carry a higher realisation risk. Increasing ratio my indicate improper deferral.
|
Accrued Expenses to Total Assets
|
Accrued Expenses / Total Assets
|
Current liability that can be easily manipulated and normally increases as the firm grows.
|
Inventory to Accounts Payable
|
Total Inventory / Total Accounts Payable
|
Normally, accounts payable increases as inventory increases and an increasing ratio indicates otherwise.
|
Intangible Assets to Total Assets
|
Intangible Assets / Total Assets
|
Intangibles may carry high risk of realisation, which lowers earnings quality because of future charge-offs.
|