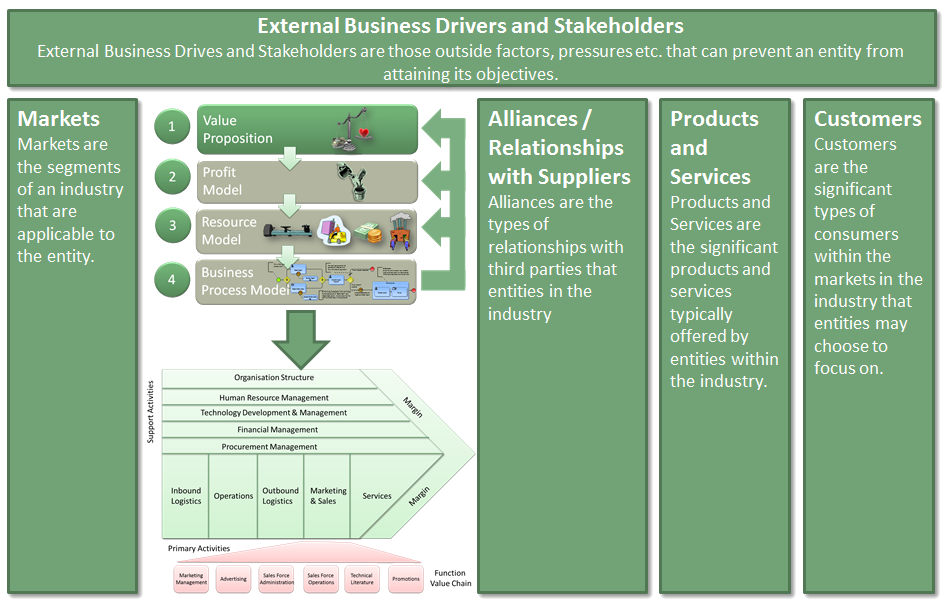
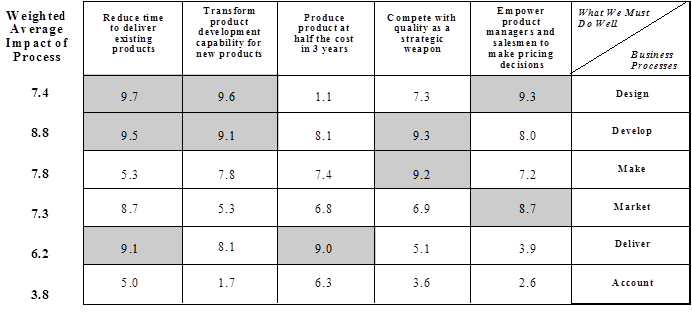
Description
- This paper is designed to provide practitioners with an awareness of the various issues involved in the selection and application of commercially available software tools in the modeling activities of BPI projects. Given the rapid pace of innovation in computer based tools, some of the detailed information about specific tools is likely to be out of date in a relatively short period of time. Practitioners are encouraged to follow major developments with regard to these products, and to seek out more detailed, current information from external sources, as standards develop, prior to the selection of software tools for a major engagement.
- Used in the process of identifying and representing the relationships between the components of a business model. The purpose of their use is ultimately to produce a model or representation of the “Future State” that drives the detailed activities of the business and system design-process.
When to Use
- These tools are used in building the Holistic Business Model and the “To-Be” Process Model, in validating the processes in the “To-Be” Validation, and in building subsequent detailed processes and technology. The presentation method should be sensitive to the organisation’s ability to absorb the information and fit the organisation’s needs as opposed to the implementation team’s needs.
Approach
- Throughout my career I have used a wide range of business process development tools/methodologies. Dynamic tools are best suited for modeling strategic relationships or detailed interactions of activities. Static tools are best suited for modeling operations, processes and activities. The following gives some general guidance on the use of dynamic and static tools, as well as some pointers on the use of specific tools.
- Dynamic modeling provide the ability to instantly represent the effect of changes in inputs and variables of the model. This is an excellent application for simulating high-level strategic relationships, and can be a powerful tool for executives to understand the implications of their decisions. The effect of decisions can be immediately seen by the changes made in model variables. While this type of model cannot be used to run the business, it can provide important insights on the outcome of strategic decisions. On the other end of the spectrum, dynamic models are the tool of choice for modeling detailed interactions of resources and observing the effect of constraints. Examples of this type of modeling include interactions of machine rates and process queue times; effect of varying demands on capacity; and simulation of new process designs. The strength of the dynamic models is in their ability to show cause-and-effect relationships, as well as the ability to calculate process time and costs. The major drawback of these models is that they are expensive, time-consuming to develop, and require a fully trained developer to create a model that will provide valid results.

- Static modeling provides a graphical illustration of process flows, activities and costs. Additionally, static modeling allows the user to break down processes hierarchically into increasing levels of detail. Through static modeling, we can develop an understanding of processes by identifying the activities and organisational functions involved. We can also identify the associated time and cost of each activity within the process. The strengths of static models is their ability to graphically depict a process in a short period of time to facilitate the understanding of "As-Is" and "To-Be" designs. Static tools are relatively inexpensive and easy to use. Their drawback has been their ability to calculate associated time and costs.
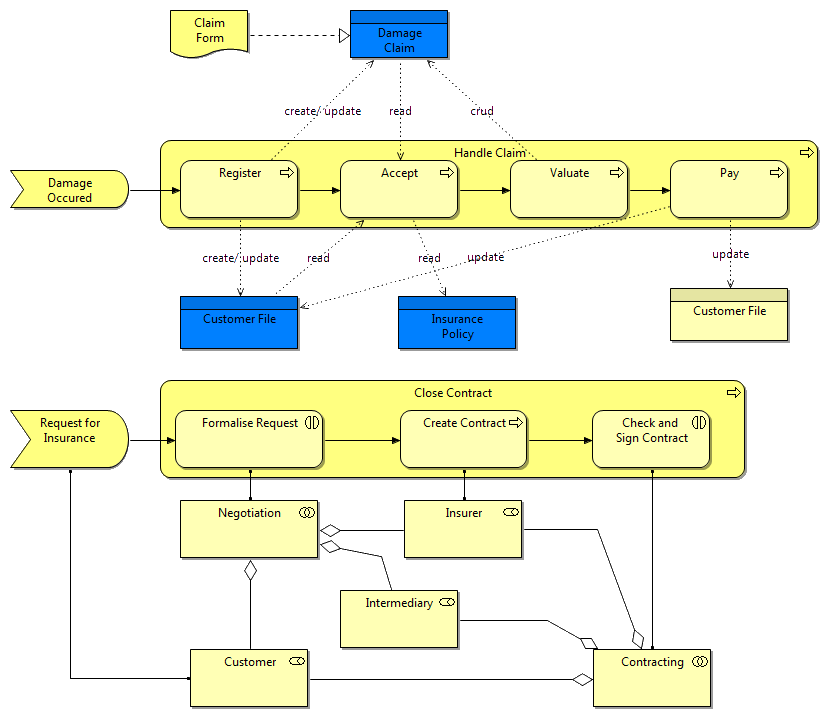
Below is a static Business Process model created using Archi a free, open source, cross-platform tool to create ArchiMate models. ArchiMate is an open and independent Enterprise Architecture modelling language that supports the description, analysis and visualisation of architecture within and across business domains. ArchiMate is one of the open standards hosted by The Open Group1 and is fully aligned with TOGAF1.
Stand-alone Documentation
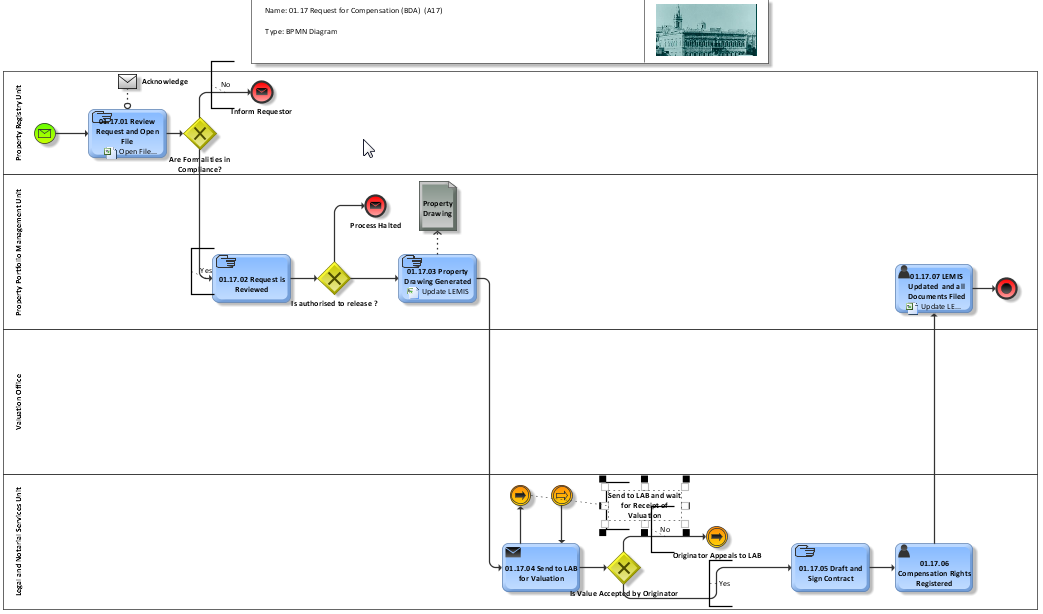
- This category is useful for mapping current and proposed process work flows, when quantitative modeling or simulation will not be required, or when the documentation capabilities of the modeling/simulation software are inadequate. These tools are essentially graphics software and may have special functions that assist the consultant in documenting process work flows. Some of the tools enable users to nest activities/processes within other activities/processes, and this simplifies the organisation and navigation of processes, and enables the storing and displaying, of various levels of detail. A Tool I use frequently for mapping out processes is ARIS Express. This tool provides the ability to develop processes in ARIS EPC format, and BPMN (Business Process Management Notation) 2.0. The EPC models can be imported into the ARIS modelling tool or exported as a document file in PDF or RTF format.
Integrated Documentation
- These tools can be applied to document and/or model current/proposed processes. A wide variety of applications with varying capabilities are included in this category. There are typical reasons to select one of the tools from this category.
- The unique functionality of a specific tool is required
- The documentation capabilities of a modeling/simulation tool that is to be used in later stages of the project are adequate for documentation purposes (will link documentation with modeling/simulation, which will save effort/time)
- In most cases, tools from this category will be used separately for one unique task within a project where these requirements apply.
Spreadsheet
- Spreadsheets can be used in at least two ways to support Business Design modeling efforts; to calculate actual or expected process results (accumulated over time); and to score workshop/assessment results. Spreadsheets are the preferred tool for process "simulation", when only end results are needed (e.g., the average time to process 500 transactions, or the total amount of resources consumed), because they are much easier to use than any of the dynamic simulators. However, if there is a need to view specific interactions of process variables over time (e.g. how does the transaction processing time vary during the day), or if complex stochastic effects have to be simulated, a continuous or dynamic simulation tool may be required.
Simulation
- Computer simulation is the process of designing a mathematical and logical model of a business system and experimenting with this model on a computer. A simulation is a dynamic portrayal of a system's operation through time. In other words, simulation is the tracing of a specific time history of a system/process. A computer simulation can also be described as a script (similar to a play script) that describes the activities that result as transactions are processed, and events occur. A model is defined by specifying a set of variables that interact to create a process.
- Dynamic simulation calculates process performance/results in many small increments over time to show specific time-varying process dynamics such as the number of vehicles waiting to be processed at different hours of the day
- Most simulations include some degree of uncertainty expressed in terms of probability distributions. As an example, the routing of transactions may be from A to B 90 percent of the time and from A to C 10 percent of the time. Other variables such as the time to process a given type of transaction through a specific step can be expressed as probability distributions that reflect the varying processing times that are possible in real life. This type of model is said to show the effect of stochastic or probabilistic processes. It can be described as a play script that varies from performance to performance. Multiple executions of stochastic models will yield different results, and may be used to predict the variability of real world processes.
- A simulation is a dynamic portrayal of a system's operation over time. This is vitally important to remember when considering the usage of simulation techniques. Consider whether there is a real need to portray the operation of the system over time, or if the need is only to calculate the average or total statistics resulting from executing the process. A simulation will show the specific interactions of system variables over time, in addition to providing end results. However, simulation is complicated and time-consuming relative to spreadsheet analyses, and requires a higher level of sophistication on the part of the client design team. Dynamic simulation models should only be used when there is a need to depict process dynamics, not just results.
- Simulation models and tools can be classified as either continuous or discrete change. Selection between these types of tools should be driven primarily by the objectives of the simulation effort.
Continuous Dynamic Simulation
- Continuous dynamic simulation treats elements of process flow in an aggregate manner. For example, in a model of an order-management system, all orders would be aggregated to comprise a total order flow, with no particular importance on any one order. Individual flow elements, like orders in an order flow, are important only in the sense that they contribute to total order flow. Information about individual transactions (e.g. an individual order) is collected only at the overall, aggregate level. The limitation of this type of simulation is that it is not able to measure attributes of specific transactions (e.g. how long did it take to process order number 101?).
- A continuous dynamic simulator should be used, when an aggregate view of process flow is sufficient or when dependent process variables change continuously over time. As mentioned earlier, if the goal is to simulate the interactions between key process variables over time, rather than dynamic simulation is appropriate. However, this tool should not be used to model strictly end results of processes; this can usually be achieved more efficiently by spreadsheet analyses.
- It is important to note that continuous simulation can be used to model managerial policies and decision making, not just physical flows and activities. It can be used to help answer questions such as “On what types of information should given decisions be based?” and “What should certain policies be?” by simulating information feedback structures embedded within all processes.
Discrete Dynamic Simulation
A discrete dynamic simulator should be used to simulate the attributes of individual entities flowing through a process, and to collect and analyse attributes about individual entities flowing through the process over time. Discrete simulation, unlike continuous simulation, treats flow entities individually. In an order management process, for example, statistics are maintained for individual orders, and it is possible to collect and analyze statistics about individual entities. Model building to achieve this requires more detail and is more time-consuming than most continuous simulations of similar processes.
Combined Continuous/Discrete Simulation
- This category is a combination of the previous two. This type of tool should be used, when both continuous and discrete simulation are required within the same model.
- The function of simulation languages — to simulate the performance of current/proposed process(es) — is identical to that of dynamic simulators (continuous and discrete). Its modeling flexibility and power, though, is superior, since virtually “anything” can be done. However, because it is so difficult and expensive to use, requiring expertise in writing code, it will usually not be a valid option. In general, the tool's extra benefits from increased flexibility and power will not outweigh its added complexity of use and the time needed to learn the language.
Pseudotyping
These tools can be applied in at least three ways: as an interactive, electronic, color storyboard/ presentation of a project, plan or results; as an interactive model of a proposed system or application; as an easy-to-use front-end or interface for a process-simulation model. With these tools, it is possible to create very user-friendly point-and-click interfaces and screens.
Stand-Alone Documentation
This category is useful for mapping current and proposed process work flows when quantitative modeling or simulation will not be required, or the documentation capabilities of the modeling/simulation software are inadequate. These tools are essentially graphics software and may have special functions that assist the consultant in documenting process work flows. Some of the tools enable users to nest activities/processes within other activities/processes, which simplifies organization and navigation of processes and enables storing and displaying various levels of detail.
Integrated Documentation
These tools can be applied to document and/or model current/proposed processes. A wide variety of applications with varying capabilities are included in this category. Typical reasons to select one of the tools from this category are:
- The unique functionality of a specific tool is required
- The documentation capabilities of a modeling/simulation tool to be used in later stages of the project are adequate for documentation purposes (will link documentation with modeling/simulation, which will save effort/time)
In most cases, tools from this category will be used separately for one unique task within a project where these requirements apply.
Spreadsheet
Spreadsheets can be used in at least two ways to support Business Design modeling efforts: to calculate actual or expected process results (accumulated over time), and to score workshop/assessment results. Spreadsheets are the preferred tool for process “simulation” when only end results are needed (e.g., the average time to process 500 transactions, or the total amount of resources consumed), because they are much easier to use than any of the dynamic simulators. However, if there is a need to view specific interactions of process variables over time (e.g., how does the transaction processing time vary during the day), or if complex stochastic effects have to be simulated, a continuous or dynamic simulation tool may be required.