In the next three Blogs I will construct a Generic Consumer Goods Organisation’s Entity Business Model.
- Part 1 - Include the Entity Business Model and Strategic Processes
- Part 2 - Includes the Core Business Processes
- Part 3 - Includes the Resource Processes
Consumer Goods - Entity Business Model
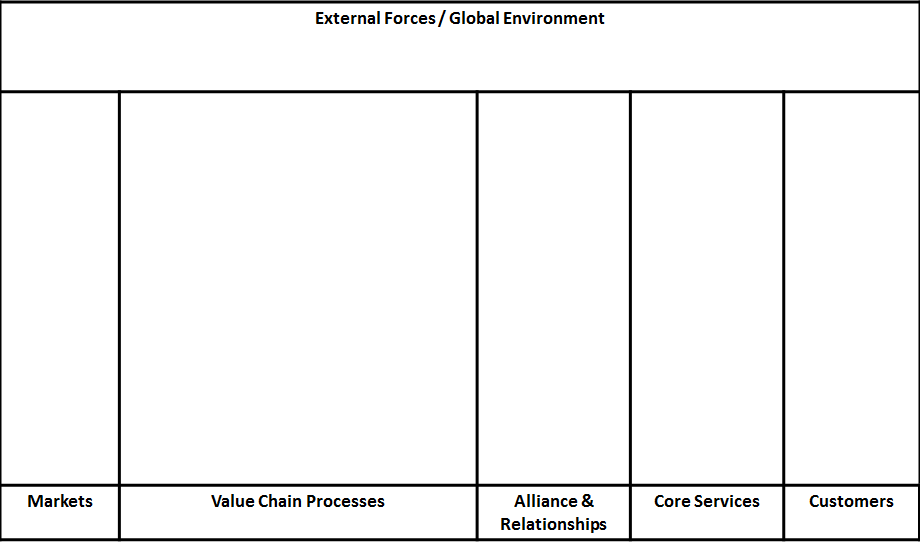
As discussed in the previous Blog the Entity Business Model is used to describe the inter-linking activities carried out within a business entity, the external business drivers and stakeholders that bear upon the entity, and the business relationships with persons outside the entity.

External Business Drivers and Stakeholders
External Business Drivers and Stakeholders are those outside factors, pressures etc that can prevent an entity from attaining its objectives. One of the ways to classify such external forces follows:
General environment:
|
Competitive environment:
|
Operating environment:
|
Markets
Markets are the segments of an industry that are applicable to the entity. When analysing Markets we may:
- Identify the entity’s significant market segments;
- Obtain an understanding of how the products and services are positioned within the market segments;
- Obtain an understanding of the relationship between an entity’s market segments and its business objectives and strategies.
Business Processes
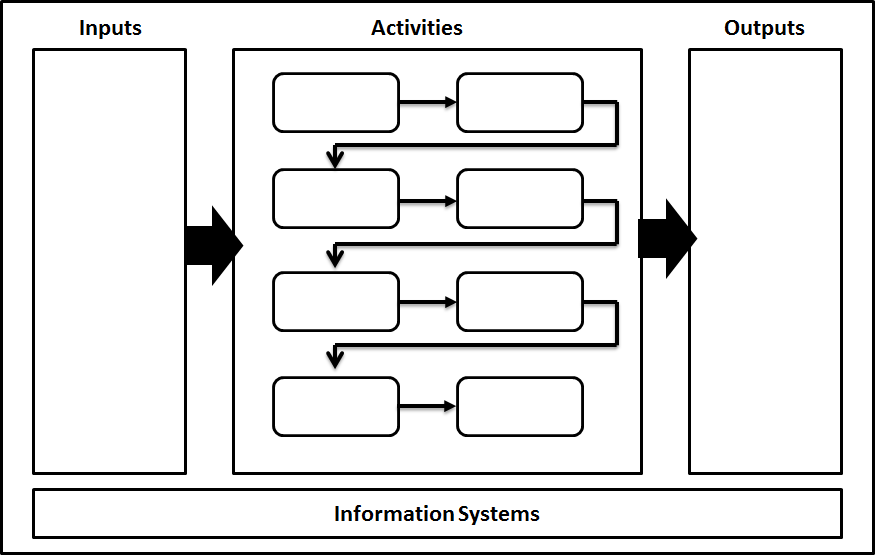
A business process is a structured set of activities within an entity, designed to produce a specified output. A business process emphasis how work is performed rather than what is done. It is also structuring of work activities across time and place to transform inputs, such as information, materials and resources, to outputs, such as the products or services for customers or other users.
Processes are usually linked with the outputs of one process being the inputs of another process.
Alliances / Relationships with Suppliers
Alliances are the types of relationships with third parties that entities in the industry may establish to:
When analysing Relationships with Suppliers we may identify an entity’s significant suppliers;
|
Products and Services
Products and Services are the significant products and services typically offered by entities within the industry. When analysing Products and Services we may obtain:
- an understanding of the entity’s significant products and services;
- an understanding of the stage that significant products and services have reached in their life cycle;
- an understanding of the relationship between an entity’s significant products and services and its business objectives and strategies.
Customers
Customers are the significant types of consumers within the markets in the industry that entities may choose to focus on. When analysing customers we may:
- identify an entity’s significant customers;
- obtain an understanding of the relationship between an entity’s significant customers and ts business objectives and strategies.
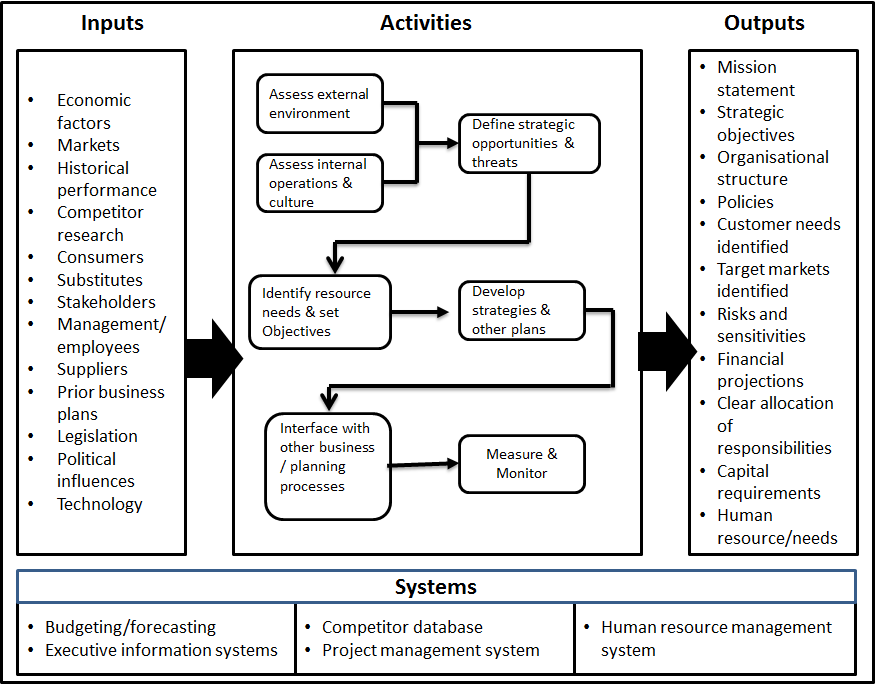
Strategic Management Processes
The strategic management process is the process that:
- Develops the entity’s mission,
- Defines the entity’s business objectives,
- Identifies the business risks that threaten attainment of the business objectives,
- Manages the business risks by establishing business processes, and monitors progress toward meeting the business objectives.
When we analyse the Strategic Management Process include how management (including the Board of directors, as appropriate):
- Sets the overall direction for the entity;
- Monitor the external environment and assess the strategic implications of potential opportunities and threats;
- Monitors the extent to which strategies have been implemented; understand the strategies and capabilities of the significant competitors; analyses the entity’s strengths and weaknesses;
- Allocates resources, including capital, people and facilities to the business processes;
- Aligns its strategic business objectives with the process objectives.
Consumer Goods - Strategic Management Processes
Process Objectives
- Provide clear strategic direction to the business
- Determine strategic objectives (e.g., profitability/market growth)
- Identify and allocate resources necessary to execute business strategy
- Measure business performance against strategic objectives
- Promote culture of continuous change/improvement
- Maximise market value of the business
Critical Success Factors (CSF’s) | KPI’s Linked to CSF’s |
|
|
Risks Which Threaten Objectives | Management Responses Linked to Risks |
|
|
Other Symptoms of Poor Performance |
|
Undefined responsibilities
Consistent failure to introduce new products/lines
|
Weak market position
Poor financial results
|
Performance Improvement Observations |
|
|
|