Wednesday, July 2, 2014

Enterprise Architecture Repositories - Part 1

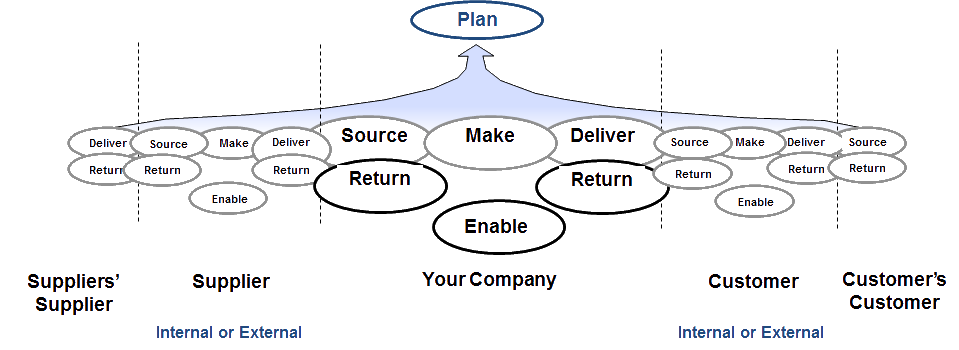
Before embarking on a Business Process Management programme consideration should be given to a structured repository to record the journey. On many of the projects I have worked on this was accomplished using a proprietary tool such as Aris. Aris has a number templates that can be acquired based on well known industry standard methods  i.e. TOGAF, ITIL, eTOM, APQC etc.. However there are also a number of Open Source Tools that I have used such as The Essential Project (http://www.enterprise-architecture.org/ ) and Archimate. Before we start on the evaluation of architecture repositories let's review the project plan once more. The plan I use was derived from my time at KPMG Singapore, Below is a pictorial view of the end to end plan which shows that it is a continuous process of improvement.
BPI Cycle Phases.png
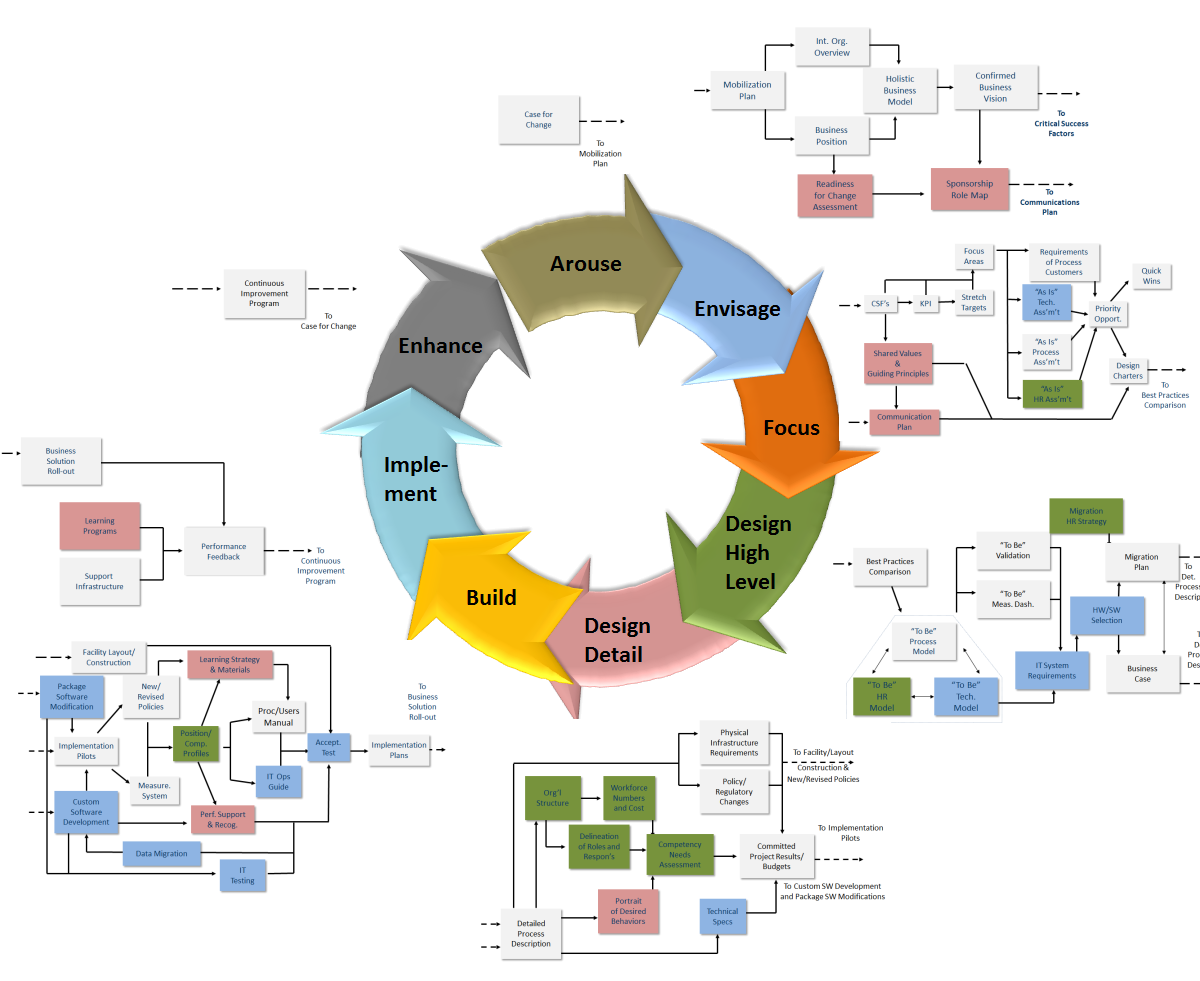
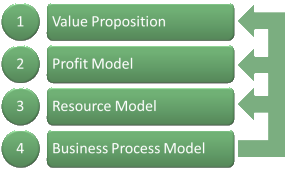
The above diagram shows that the project (programme) can contain multiple parallel projects which are depicted by the colour coding of the sub-projects:

Activity Responsibility.png

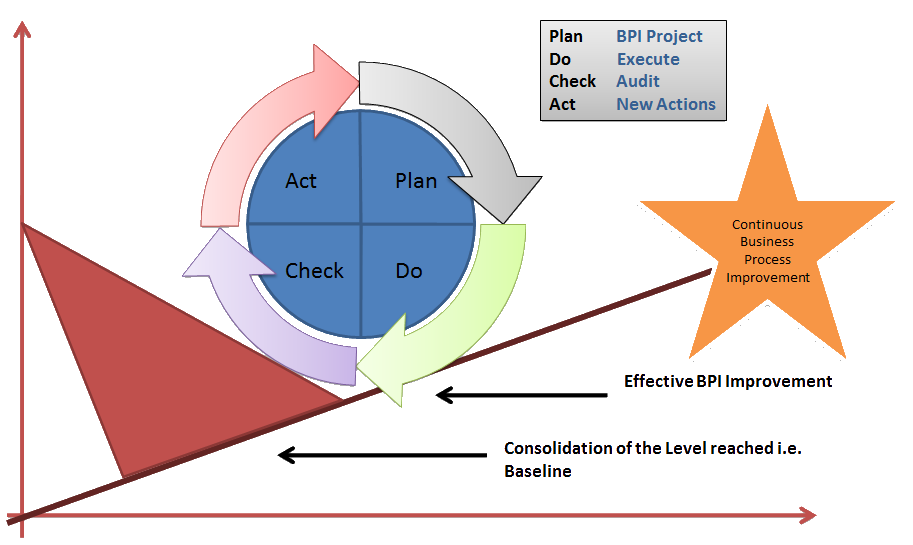
It is important therefore that the repository provides a means of capturing the changes and quantifying the improvements to enable an assessment of the projects success or failure.
I tend to keep in mind Demings Cycle which depicts a continuous assessment of performance to provide justification for the continuous investment in process improvements.

Demming Cycle.png

Saturday, May 3, 2014

Business Process Management Maturity Assessment

I have been engaged on a number of projects where businesses were not ready or prepared to engage on a Business Process Management Project. In some cases the IT department have engaged on Enterprise Architecture Projects but do not have the support of the business owners (sponsors) when it comes to defining a Business Architecture. When engaging on a Business Process Management project it is worthwhile reaching out to the Senior management within organisation to test if they are ready to accept changes to their core processes and whether there is a member of the organisation that is responsible for driving the Business Process Improvement (BPI) programme. I find in these cases it is worthwhile carrying out a quick assessment on whether the organisation is prepared to embark on a BPI project. To achieve this I developed a quick assessment based on the goals defined in the OMG Business Process Maturity Model (BPMM) Version 1.0 document.
Enter a number 0 to 5 in the percentage attained column for each of the Maturity Levels Specific Goals (SG) and Institutional Goals (InG). It is conceivable that scores may be achieved in all Levels of the Maturity Model; however in each level you may have score below 100%. This will provide a gap analysis at each level and a plan put in place to approve on the overall score for each level.
Note: Institutionalisation goal make the process ingrained in the way work is done in the organisation. It is a critical aspect of implementing any process.

Scoring Table:
Score
%age
Guide
0
0
Not Planned
1
20%
Planned
2
40%
Initial Implementations
3
60%
In use but not  fully implemented
4
80%
Fully Implemented
5
100%
Mature and Institutionalised
Level 1 Initial – is considered “Fire-fighting management” in the BPMM Assessment. There are no specific objectives. Success in these organisations depends on the competence and determination of the people in the organisation and not on the use of proven processes and so is not included in the assessment as this is business as usual.
The Gap Analysis can be used to focus programmes on lowering the Gap at each level moving the Organisation towards the ultimate Goal of Level 5.

Below is a sample of the questionnaire built in Excel. The approach would be to obtain a consensus of opinion from a senior management team within the Organisation through a workshop.


The scores can then be graphically displayed and provide an agreed baseline for defining the programme for business process improvement within an organisation.


If you want copies of the Excel and Word worksheets please contact me on david.brown@biz-performance.com


Wednesday, April 16, 2014

The affect of Process Decomposition on Profit

Carrying on from the previous Blog when I was at Unisys we used demonstrate the positive impact of MRP on a business using Dupont Analysis. The formula developed by DuPont is used by many companies to evaluate how effectively assets are used through measuring the combined effects of profit margins and asset turnover.

There are two main performance ratios associated with establishing a profit model:

  1. Return on Equity (ROE) which is used as a general indication of the company's efficiency; in other words, how much profit it is able to generate given the resources provided by its owners. Calculated by (Net Profit) / (Average Shareholder Equity for Period)
  2. Return on Total Assets (ROTA) a measure of how effectively a company uses its assets. Calculated by (Profit before interest and tax) / (Total Assets).
You may ask the question why? It really is quite obvious. ROE is a measure of what an investor gets back in monetary terms from the trust he or she puts in the management team of an organisation. Whereas the Return on Assets is a very good measure of how the management team is using the Assets of a company to generate a profit.
ROTA can be used to measure the operating efficiency of the business and is the ratio over which operational management has the most control. There two main drivers that impact ROTA are:

  1. Margin on Sales percentage – Calculated by( PBIT / Sales)
  2. Sales to Total Assets Ratio – Calculated by (Sales / TA)
If we now drill down on Margin on Sales, there are four main drivers these are Materials, Labour, overheads and Admin/Selling expense. Each of these can be broken down further with their own drivers to provide a means of a more detailed analysis. Likewise if we drill down on Sales to Total Assets the most significant drivers are Fixed Assets, Inventories and Accounts Receivables which again can again have their own drivers defined to increase the operational control over the activities.
A simple spreadsheet model can be created to provide a means of adjusting the drivers to evaluate the impact on ROTA and ROE. Also a 3 to 5 years outlook can be built to ensure that model supports the aspirations of the owners and stakeholders. The cost ratios provide a mechanism to plan, budget, delegate responsibility and monitor the various functions. They can quantify the target for all areas and calculate the affects of disparity in any one of the subsidiary ratios on the overall performance. A simple spreadsheet model can demonstrate the impact of changing driver values on the higher level performance ratios.

This model does not handle very well the detail around variation in different products, material costs, changes in volumes and different asset depreciation policies. There are many good planning tools around that can be used for detailed planning; however, as a first cut the DuPont Model provides an excellent insight into the impact of ratio variations on the profitability of a business.

Saturday, April 5, 2014

The E-Business Time Warp

This is a bit of nostalgia from my Consulting days whilst living in Singapore. The organisation I worked for was an Oracle E-Business business partner. As part of my responsibility I was invited by Oracle to accompany some of our prospects to their annual conference in New Orleans. One of the events was based on the Rocky Horror Show where we were all given Tee Shirts that were printed on the back with the words below sung to The Time Warp. The words give you Oracles messages and their competitors at that time most of which have been acquired by Oracle or otherwise disappeared.

RIFF-RAFF

It’s astounding,
time is fleeting,
Madness takes it’s toll,
but listen closely….

MAGENTA

Not for very much longer,

RIFF-RAFF

I’ve got to keep control,
I remember glue-ing the pieces!
Connecting…. ….the moments when,
Application’s would stop working,
and programmers would be lurking….

CHORUS

Let’s glue the pieces again! Let’s glue the pieces again!

RIFF RAFF

You take a piece from SAP….

CHORUS

And then a piece from i2.

DR. FRANK

You put your hands in your pockets.

CHORUS

An integration stew,
and they take so long
It really drives you insane.
Let’s glue the pieces again! Let’s glue the pieces again!

MAGENTA

It’s so dreamy.
Ok, patchwork free me!
So you cann’t see me, no, not at all.
In another dimension, with integration intentions.
Where secluded, I see all.

RIFF RAFF

With a bit of the mind flip.

MAGENTA

You’re into the profit slip!

RIFF RAFF

And nothing can be the same.

MAGENTA

You’re spaced out on glazed donuts!

DR. FRANK

With a sprinkle of walnuts!

CHORUS

Let’s have a latte’ again! Let’s have a latte’ again!

REPRISE:

MAGENTA

Well I was walking down the street, just a-having a think,
when a C-E-O gave me an evil wink.
He shook-a me up, he took me by surprise,
he had a lotto cash and the devil’s eyes.
He stared at me and I felt a change,
time meant nothing, never would again.

CHORUS

Let’s do the Time Warp Again! Let’s do the Time Warp Again!

RIFF RAFF

You take a piece from SAP….

CHORUS

And then a piece from i2.

DR. FRANK

You put your hands in your pockets.

CHORUS

Integrators have no clue,
and they take so long
it really drives you insane.
Let’s glue the pieces again! Let’s glue the pieces again!

DR. FRANK

A bit of Clarify here…

CHORUS

An then some Broadvision there…

DR. FRANK

Peoplesoft and Ariba…

CHORUS

An Integration Nightmare
and it takes so long
it really drives you insane.

Let’s glue the pieces again! Let’s glue the pieces again!

Friday, April 4, 2014

The Profit Model


Business Model Small - Complete.pngWhen developing a Business Process Architecture there needs to be an understanding of the Profit Model being pursued by the Organisation. The process activities at all levels within a Business Architecture support the Profit Model which in turn contributes to the Value Proposition.

There is an excellent book “Key Management Ratios” written by Ciaran Walsh which explains the profit model and the key ratios that support the sustainable profitability of an organisation. Without this understanding it will difficult to build a Business Process Architecture that supports the Organisation's Business Model. In my previous Blogs I discussed the development of core end-to-end business processes through the use of industry specific frameworks. The recording and presentation of the financial success of these frameworks is maintained in the Finance Processes. Below is a diagram of the Cash Flow within a typical commercial organisation. It highlights the fine balancing act required to manage the cash inflows  and cash outflows during a typical production cycle.  

Cash Flow Model.png


The above diagram shows how the Cash Reservoir supports the core processes and the financial interfaces that manage the cash inflows and outflows enduring there is sufficient cash available to execute a full production cycle.
The diagram below shows how we measure the liquidity of an organisation and provides an end-to-end process measured in Working Capital Days. This can be further decomposed so that responsibility for lower levels of processes into payable days and receivable days that can affect the Time Gap-Cash in/Cash-out and the funding requirements of the organisation,

Working Capital Days.png

This example highlights the need for Business Architects to have both and Industry Knowledge and an understanding of the resource requirements of an organisation within the industry sector it operates in.

Sunday, March 23, 2014

Supply Chain Operations Reference (SCOR)

The Supply Chain Council (SCC) SCOR Framework is the last process framework that I will discuss at this time. It provides and integrated end-to-end process,value chain, within an organisation linking both suppliers and customers.I have used this framework many times to categorise process types. SCOR has six major management processes types:

  1. Plan - describe the activities associated with developing plans to operate the supply chain.
  2. Source- describe the ordering (or scheduling of deliveries) and receipt of goods and services.
  3. Make - describe the activities associated with the conversion of materials or creation of the content for services.
  4. Deliver - describe the activities associated with the creation, maintenance and fulfillment of customer orders.
  5. Return - describe the activities associated with the reverse flow of goods.
  6. Enable - describe the activities associated with the enabling the management of the supply chain.

There are recommended metrics for each of the process categories. This is very useful as developing and managing processes without metrics is pointless exercise.


SCOR Overview.png

The SCOR model has 3 levels of processes shown in the diagram below with levels 4 and 5 defined as business and organisation specific.
SCOR Process levels.png
The SCOR process architecture can be easily transformed into an application requirements diagram:
Suuply Chain Space.png
I have used this in the past to analyse the gaps in the supply chain architecture and put a place a strategy and budget to fill the gaps.You may notice I have added design in this diagram, this is an extension to SCOR covered in DCOR.

Sunday, March 16, 2014

Information Technology Infrastructure Library (ITIL)


Managing Information Technology (IT) is a Resource Process Category supporting the Value Chain. ITIL is a “best practice”approach that has been proven in practice and is accepted by organisations focused on improving their IT services. ITIL can be used as framework and as a reference model on which to develop IT service processes that integrate with the daily operations of an organisation. Using a framework can accelerate the development of the processes and provides a checklist  to ensure all requirements are covered.

The above diagram is a high level representation of the ITIL framework created in ARIS Express. From the above EPC Value Chain Diagram more detailed processes can be developed and linked providing a process map. ITIL has five process groups that cover the processes required for the planning, design and development of the day to day operations of an IT Services operation and the continual improvement of those processes.
  1. Service Strategy
  2. Service Design
  3. Service Transition
  4. Service Operation
  5. Continual Service Improvement
The ITIL framework is not just a reference mode for IT Service Organisations. I have on past  projects, referred to the ITIL Framework when developing customer service help desk processes when integrating with CRM.
One of the major advantages of using standard frameworks is that they often come with suggested Key Performance Indicators (KPIs). KPIs are used to continuously monitor the performance of key business processes as part of a continuous process improvement programme, and also be used to compare a company's performance against it’s competitors in a similar industry segment. Below is a list of suggested KPI’s associated with ITIL Incident Management.